外觀
Count matrix、過濾與標準化 (Filtering & Normalization)
檢查 count matrix 與 sample metadata 是否對齊,過濾低表現基因,並清楚區分 RNA-seq 中不同 normalization 方法的用途。TMM 是本章核心範例。
本節使用模擬資料示範分析流程,結果不代表真實生物學研究發現。
Count matrix 與 metadata 檢查
輸入資料:
data/simulated_gene_counts.csvdata/sample_metadata.csv
基本檢查:
r
library(readr)

counts_tbl <- read_csv("data/simulated_gene_counts.csv", show_col_types = FALSE)
metadata <- read_csv("data/sample_metadata.csv", show_col_types = FALSE)

sample_cols <- setdiff(names(counts_tbl), c("gene_id", "gene_symbol", "length"))
count_mat <- as.matrix(counts_tbl[, sample_cols])
rownames(count_mat) <- counts_tbl$gene_id

stopifnot(!anyDuplicated(metadata$sample_id))
stopifnot(setequal(colnames(count_mat), metadata$sample_id))
metadata <- metadata[match(colnames(count_mat), metadata$sample_id), ]
stopifnot(identical(colnames(count_mat), metadata$sample_id))
stopifnot(!anyNA(metadata))

table(metadata$group)
design <- model.matrix(~ group + batch + sex + age, data = metadata)
qr(design)$rank == ncol(design)
完整 script:
bash
Rscript scripts/metadata_design_checks.R data/simulated_gene_counts.csv data/sample_metadata.csv注意:metadata 順序錯誤是 RNA-seq 中最危險的錯誤之一,因為程式可能不報錯,但 differential expression 的 group label 已經套到錯的 sample。
低表現基因過濾 (Low-expression Filtering)
移除幾乎沒有資訊的低表現基因,降低 multiple testing burden,改善 mean-variance modeling。
低表現基因常造成:
- 大量 zero counts。
- fold change 極不穩定。
- dispersion 估計不穩。
- p-value 大多無資訊但仍增加 FDR 校正負擔(獨立過濾的原理見 多重檢定)。
固定 CPM threshold 範例:
r
library(edgeR)

y <- DGEList(counts = count_mat)
cpm_mat <- cpm(y)
keep_fixed <- rowSums(cpm_mat >= 1) >= 3
Design-aware filtering:
r
group <- factor(metadata$group)
design <- model.matrix(~ group)
keep <- filterByExpr(y, design)
y <- y[keep, , keep.lib.sizes = FALSE]
filterByExpr() 會根據 library size、group replicate 結構與 design 決定合理門檻,比單純固定 CPM 更貼近實驗設計。
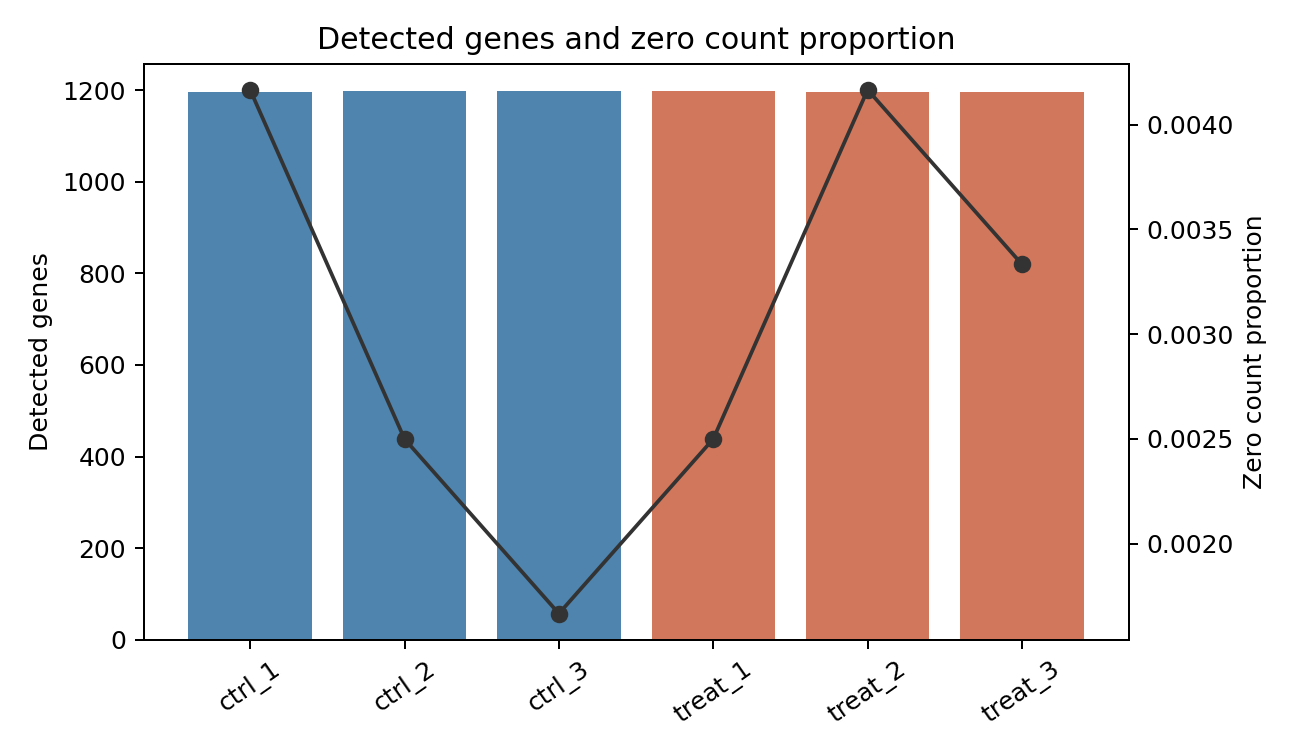
圖 1. 每個樣本偵測到的 gene 數與 zero count proportion。若某一樣本偵測基因數明顯偏低,需回到 RNA quality、library size、mapping rate 或 duplication 檢查。
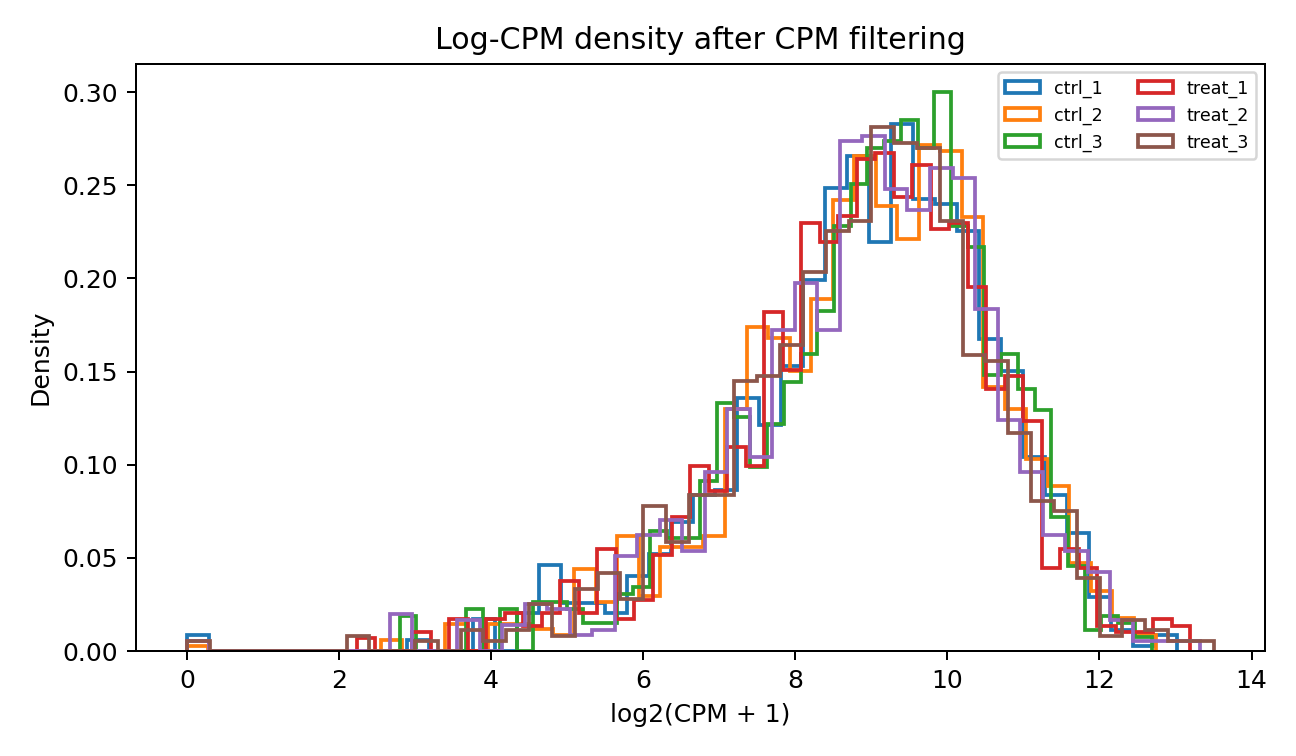
圖 2. CPM filtering 後的 log-CPM density。過濾後低表現尖峰會減少,但不應把具有實驗設計意義的小型 gene set 全部過濾掉。
標準化的概念
RNA-seq normalization 不是單一問題:
| Concept | What it corrects | Example |
|---|---|---|
| Sequencing depth / library size | 每個樣本 reads 數不同 | CPM、size factor |
| Composition bias | 少數高表現基因佔比改變造成其他基因相對下降 | TMM、median-of-ratios |
| Gene length | 同一樣本內長 gene 更容易累積 reads | RPKM/FPKM/TPM |
| Between-sample normalization | 樣本間比較同一 gene | TMM、DESeq2 size factors |
| Within-sample normalization | 同一樣本內比較不同 gene/transcript | TPM |
| Statistical model offset | 在 GLM 中校正 exposure/scale | edgeR effective library size、DESeq2 size factors |
重點:TPM 很適合描述同一樣本內 transcript composition,但不是 edgeR/DESeq2 的 raw count input。TMM/DESeq2 size factor 是 differential expression 模型的 between-sample normalization,不是 gene length correction。
標準化方法比較
| Method | Library size | Gene length | Within-sample comparison | Between-sample DE | Direct input to edgeR/DESeq2 | Common misuse |
|---|---|---|---|---|---|---|
| Raw counts | no | no | no | no without model offset | yes | 直接畫樣本間 barplot 比大小 |
| CPM | yes | no | limited | descriptive only | no as transformed input | 用 CPM 跑 DESeq2 |
| RPKM | yes | yes | rough | poor for composition bias | no | 跨樣本 DE testing |
| FPKM | yes | yes | rough | poor for composition bias | no | 當作 count |
| TPM | yes, sum fixed | yes | yes | descriptive with caution | no | 直接 edgeR/DESeq2 |
| TMM | yes + composition | no | no | yes with count model | edgeR factor, not matrix replacement | 以為校正 gene length |
| TMMwsp | TMM variant for many zeros | no | no | yes in edgeR | edgeR factor | 不理解 zero-heavy context |
| DESeq2 median-of-ratios | yes + composition | no | no | yes with DESeq2 | DESeq2 size factor | 對全零/多零資料不檢查 |
| Upper-quartile | robust library scaling | no | no | sometimes | model-specific | 忽略 composition extremes |
| Quantile normalization | forces distributions equal | no | sometimes microarray | usually not count-model default | no | 破壞 count mean-variance |
TMM 標準化
TMM 是 Trimmed Mean of M-values。它處理的核心問題是 composition bias:如果少數基因在某個樣本中極高表現,總 library size 變大,其他大多數基因即使 absolute expression 沒變,單純 CPM 也會看起來下降。
名詞
| Term | Meaning |
|---|---|
| Reference sample | TMM 計算 log-ratio 時的比較基準 |
| M value | log expression ratio,常寫成 log2 fold change-like quantity |
| A value | average log expression,代表 absolute expression level |
| Trimming | 去掉極端 M 與 A,避免 DE genes 或低 count genes 主導 normalization |
| Weighted mean | 對保留下的 genes 計算加權平均 log-ratio |
| Scaling factor | 由 trimmed weighted mean 轉換出的 sample factor |
| Normalization factor | edgeR 儲存在 y$samples$norm.factors 的 factor |
| Effective library size | library size * normalization factor |
| Offset | GLM 中用來校正 exposure 的 log effective library size |
簡化公式:
其中 (Y_{gk}) 是 gene (g) 在 sample (k) 的 count,(N_k) 是 library size,(r) 是 reference sample。TMM 對極端 (M) 與 (A) 做 trimming 後,計算加權平均並轉成 normalization factor。
R 範例
r
library(edgeR)
library(readr)

counts_tbl <- read_csv("data/simulated_gene_counts.csv", show_col_types = FALSE)
metadata <- read_csv("data/sample_metadata.csv", show_col_types = FALSE)
counts <- as.matrix(counts_tbl[, metadata$sample_id])
rownames(counts) <- counts_tbl$gene_id

group <- factor(metadata$group)
design <- model.matrix(~ group)

y <- DGEList(counts = counts, group = group)
keep <- filterByExpr(y, design)
y <- y[keep, , keep.lib.sizes = FALSE]
y <- normLibSizes(y, method = "TMM")       # edgeR < 4.0 用 calcNormFactors()

y$samples[, c("lib.size", "norm.factors")]
y$samples$effective_lib_size <- y$samples$lib.size * y$samples$norm.factors

log_cpm <- cpm(y, log = TRUE, prior.count = 2)
edgeR 4.0 起 calcNormFactors() 改名為 normLibSizes()(舊名仍可用但會提示)。TMMwsp 是 TMM 的變體,對稀疏、零值多的資料較穩定,會利用只在單一樣本為正的 counts。
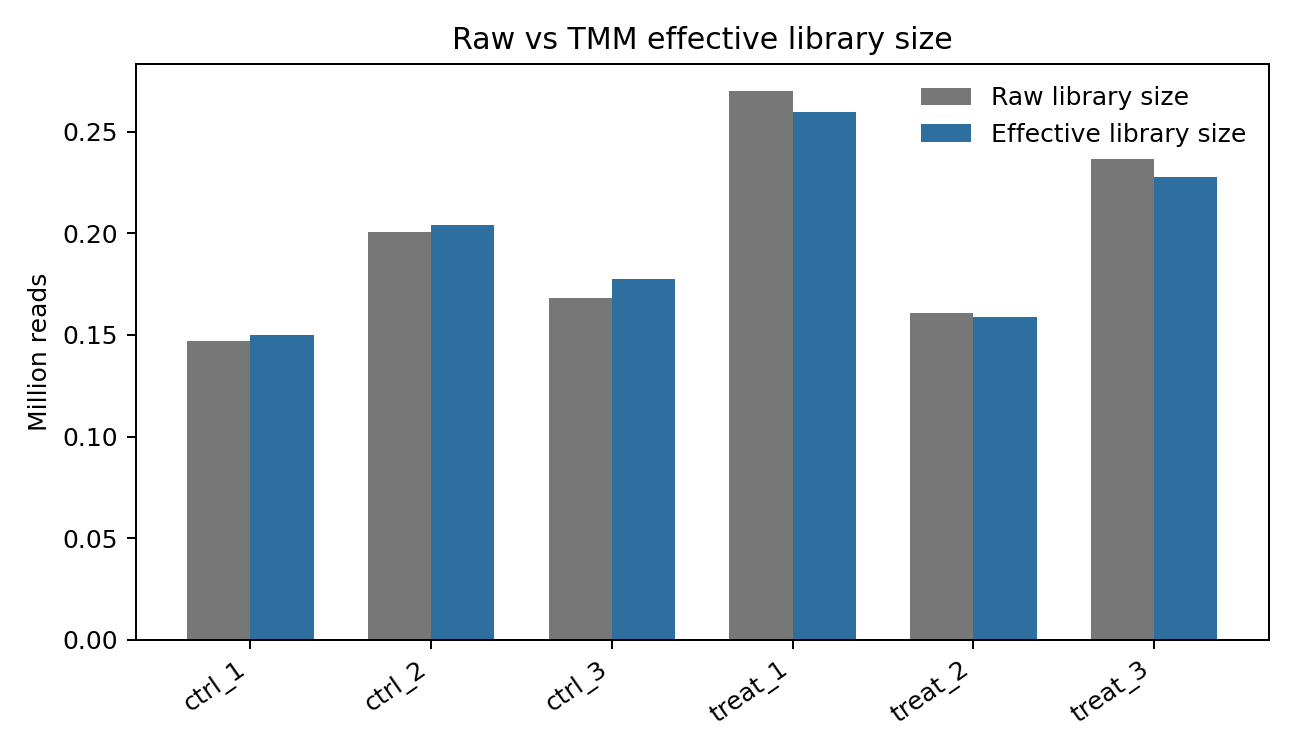
圖 3. 原始 library size 與 TMM effective library size。TMM 不只是把每個樣本除以總 reads,而是調整 composition bias 後的有效 exposure。
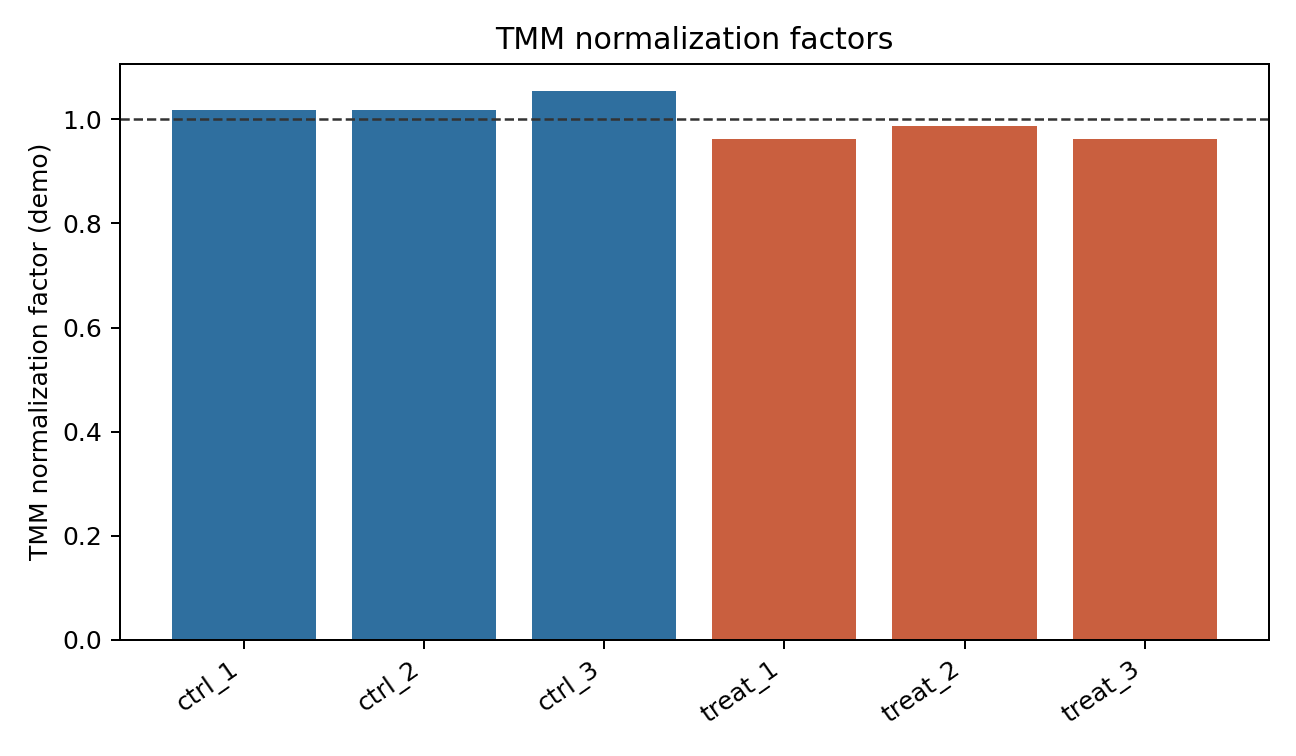
圖 4. TMM normalization factor。factor 大於 1 表示該樣本 effective library size 被放大,factor 小於 1 表示被縮小。
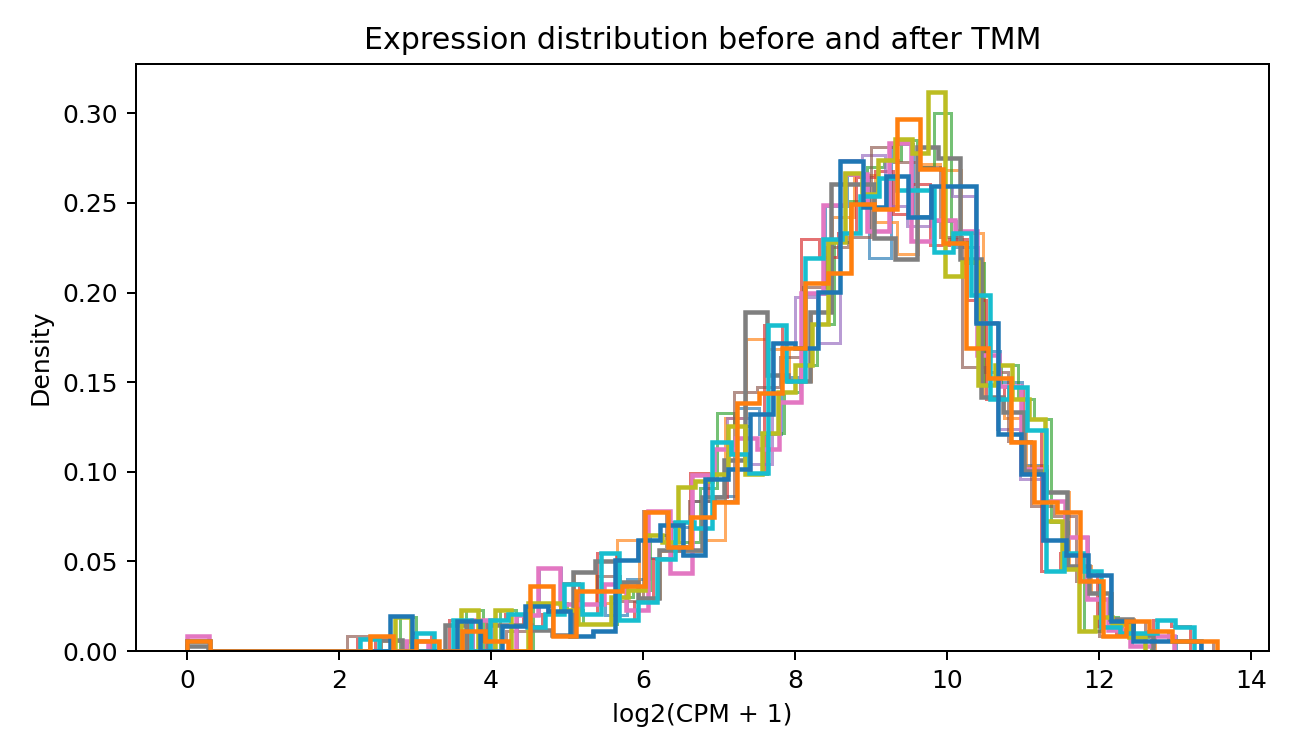
圖 5. TMM normalization 前後的 log-CPM density。normalization 後分布應更適合樣本間比較,但不要求所有樣本完全相同,因為真實 biological signal 也可能改變分布。
TMM 與其他方法比較:
- TMM vs CPM:CPM 只除 library size;TMM 另校正 composition bias。
- TMM vs TPM:TPM 校正 transcript length 並讓樣本內 TPM sum 相同;TMM 不校正 gene length,主要給 count model 做樣本間 normalization。
- TMM vs RPKM/FPKM:RPKM/FPKM 以 gene length 與 library size 描述 abundance,但不適合作為 count-based DE input。
- TMM vs DESeq2 median-of-ratios:兩者都處理 composition bias;TMM 使用 trimmed log-ratio weighted mean,DESeq2 用 pseudo-reference geometric mean 與 median ratio。
TMM 適合大多數 bulk RNA-seq gene-level count DE。若全局性表達改變、spike-in 設計、極端 cell composition shift 或大量 genes 真實同向改變,需額外評估 normalization 假設。